


The laboratory of trace elements
Head of the Geochemical Monitoring Functional Unit: Manfredi LONGO
E-mail: manfredi.longo@ingv.it
Laboratory contact person of Trace elements in liquid matrices: Lorenzo BRUSCA
E-mail: lorenzo.brusca@ingv.it
E-mail: laboratoriotracce.pa@ingv.it
The laboratory of trace elements
The laboratory of trace elements (fig.1) performs analyses for the quantitative determination of a good part of the periodic table elements (fig.2), present in concentrations of the order of g/l (micrograms per liter) and ng/l (nanograms per liter) in samples of natural waters (groundwater, thermal, marine, rain). Furthermore, after specific preparation, we analyze fluids fumaroles, samples in solid phase such as rocks, soils and plants and aerosol. These analyses are conducted by means of spectrometry technique with plasma source.
The plasma is considered to be the fourth state of matter; it is an ionized gas composed by a set of electrons and positive ions whose total charge is zero. On the earth, this form of matter is very rare: in nature we can observe lightning, as columns of ionized gas, generated by the discharge of atmospheric electricity towards the ground that allows the ionization of the gas present in the atmosphere when crossed by such electricity. The plasma state is widespread in the universe representing more than 90 percent of matter known such as stars and nebulae.
Plasma can be generated artificially by inductive coupling ICP (Inductively Coupled Plasma), namely through the transfer of energy (coupling), by means of electromagnetic induction: a mono-atomic inert gas (argon) is made to flow through a quartz tube (torch), inside a coil, where a radio frequency field is applied (RF), this generally produced by a generator at 27,40 megaherzt. In order to start the gas ionization, an electrical charge (piezo) shall be applied to argon, then once triggered, the plasma will be maintained by the RF field that generates continuous collisions between particles and atoms. The temperature you can reach (with such a technique) is about 10000 degrees °C, in the central part of the plasma.
The instruments in the laboratory are an Agilent 7800 ICP-MS (Fig. 3) and an Agilent 5900 ICP-OES (Fig. 4). Both instruments are equipped with an autosampler that allows the automatic analysis of approximately 200 samples, both are fitted with a protection system to preserve the samples from external contamination during analysis and are also connected to a suction system to prevent the accumulation of acid vapours inside the box.
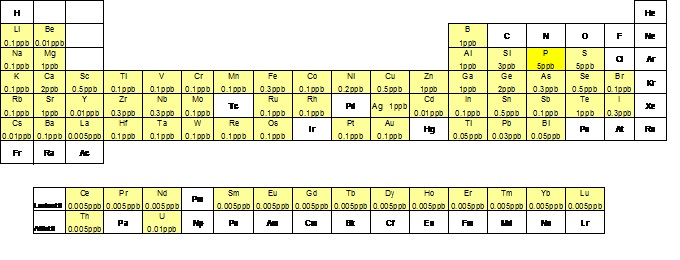
Fig.2: Elements analyzed in the laboratory of trace elements and their detection limit.
The liquid sample is aspirated by means of a peristaltic pump towards a nebulizer where, a transverse flow of argon, invests the liquid, transforming it into aerosol inside a chamber (spray chamber), in which the larger particles (Ø>10 micron) are removed by condensation on the walls of the chamber itself. Tiniest aerosol is instead conveyed towards the inside of the torch and then towards the plasma where it is desolvated, brought to the gaseous state, then atomized and finally ionized thanks to high temperatures reached into the heart of the plasma. The suitably channeled ions towards a mass spectrometer, will allow the qualitative and quantitative analysis of the sample (ICP-MS). Besides ionization, the temperature is sufficiently high to cause a significant number of excitations by collision (and ionization) of the sample atoms that subsequently decay towards lower energy states through radiant energy transitions (emissions) at specific wavelengths (fig. 5). The intensity of these emissions, in turn, will be proportional to the concentration of the same element, thus allowing the analysis of the sample, using the principles of optical emission spectrometry (ICP-OES).
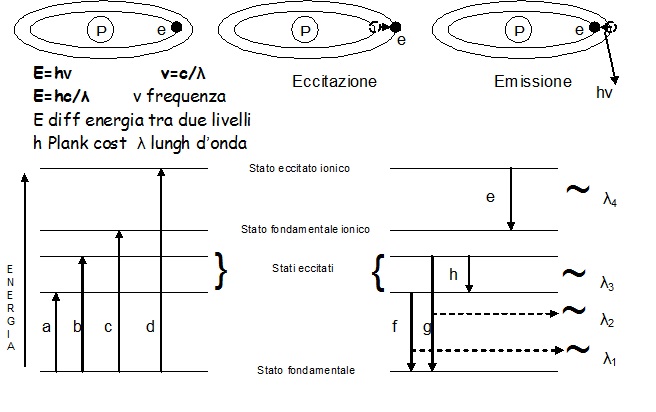
Fig.5:Diagram of energy levels and energy transitions
The main advantage of these analytical techniques is to perform a multi-elementary analysis in a few minutes, in small sample volumes, without a specific pretreatment of the same, except for the elimination of any particles, through a filtering. On the contrary, the equipment, management and maintenance costs, are generally higher than those of other instruments such as, for example, the atomic absorption (AAS, GF-AAS). Not all items can be analyzed and not in the same order of concentration for different reasons, involving the chemical-physical characteristics of the element, their presence and abundance in nature, possible interferences and much more.
How the ICP-MS works (Fig.6)
Ions formed in the plasma pass through the holes of a decreasing diameter of the sampler cone and the skimmer cone, forming a tightly focused beam of particles. This beam will pass through a series of ionic lenses thanks to the application of an electrical potential, different among the various lenses; these allow on the one hand the elimination of photons and electrons and on the other hand the maintenance of the kinetic energy, enough to traverse the entire system. Polyatomic compounds (oxides, chlorides and argon compounds) may form in plasma, generating interference problems on the investigated masses. For example, the arsenic has a nominal mass of 75 amu (atomic mass unit) and in the case in which the matrix was rich in chlorine (35 amu), this can bind argon (40 amu), thus interfering on the mass of our analyte of interest. For this reason – downstream of the ionic lenses – an abatement cell of interferences is placed, this generally using inert gases which are used to break ties of polyatomic compounds; or reactive gases that binding to the polyatomic compound will change the resulting mass. Furthermore, in the clash with the gas in the cell, there is a loss of energy that for a molecule is greater than for a single ion. The ions enter the quadrupole where they will be discriminated as a function of their ratio m/z (mass/charge). The electromultiplier, placed at the exit of the quadrupole, has finally the task of quantifying the concentration of the analyte after external calibration.
The entire system is naturally placed under vacuum by means of rotary and turbomolecular pumps.
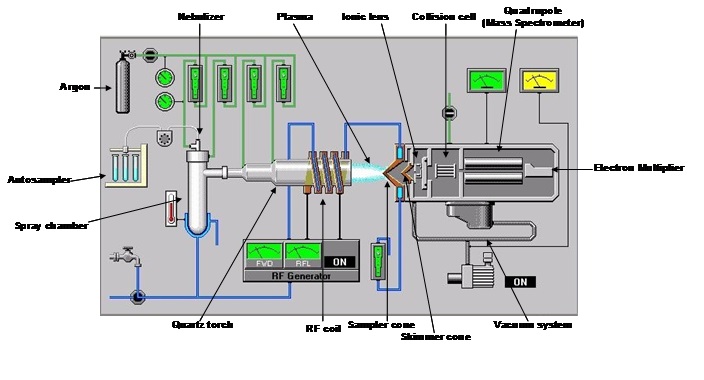
Fig.6: Scheme of ICP-MS (Agilent 7500)
How the ICP-OES works(Fig.7)
The detection system in an ICP-OES is different compared with an ICP-MS; it exploits the ability of plasma as source of optical emissions. Since the issuance of the various elements in a sample will be contemporary, the detection system separates the various wavelengths issued through a diffraction grating (monochromator), so capable of cleaving a beam of polychromatic light into more beams of monochromatic light (that is formed from a single wavelength). Finally, by means of a photomultiplier system, the intensity of individual wavelengths is measured. This is proportional to the concentration of the analytes that were previously calibrated through a known concentration standards.
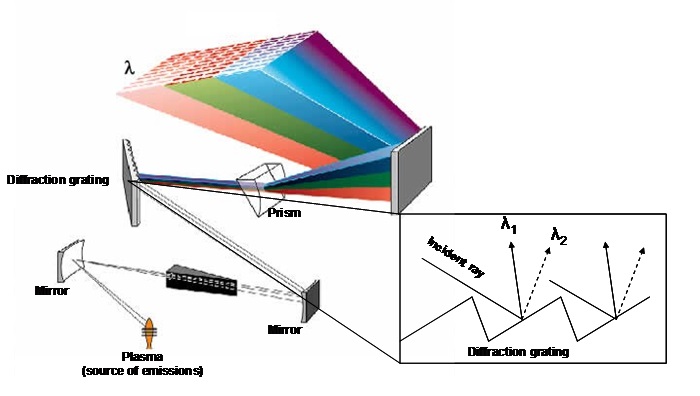
Fig.7: Diffraction diagram of a polychromatic light source
Every analytical session includes a calibration routine for all the elements to be quantified, through the analysis of labor standards with increasing concentrations and which may vary in number, from a minimum of 6 to a maximum of 12, to cover from 3 to 6 orders of magnitude of concentrations, that is from tens of ng/l up to mg/l
(fig.8). The calibration curves are measured as a function of different parameters, such as linear regression (R), the value of concentration calculated with respect to the chemical one of each standard, the accuracy of the value (RSD) and the stability of the internal standard signal that can be viewed in detail (fig. 9). During the analytical sessions, different internal standards are used (Y, Rh, In, Re) for checking the matrix effect, being directly introduced on-line into the introduction system, through a T graft which ensures constant and continuous introduction. For a correct evaluation of the data, precision and accuracy are always taken into account.
Analytical precision
It is a measure of the dispersion of the values obtained by replicating repeatedly the analysis on the same sample: generally in our laboratory this measure is carried out replicating from 3 to 5 times the analysis and calculating the value of the relative standard deviation (RSD).
Measurement accuracy
It is the degree of agreement between the mean value measured and the real one. This evaluation is carried through the analysis of certified standards (CRM) that, in our case, are the following:
SPS-SW1 and SPSSW2, Spectrapure Standards;
NIST 1643, National Institute of Standards & Technology;
TM-27.3, TM 61.2 and TM Rain-04, Environment Canada;
SLRS5, National Research Council Canada
The CRM used, may change over time, depending on their availability on the market.
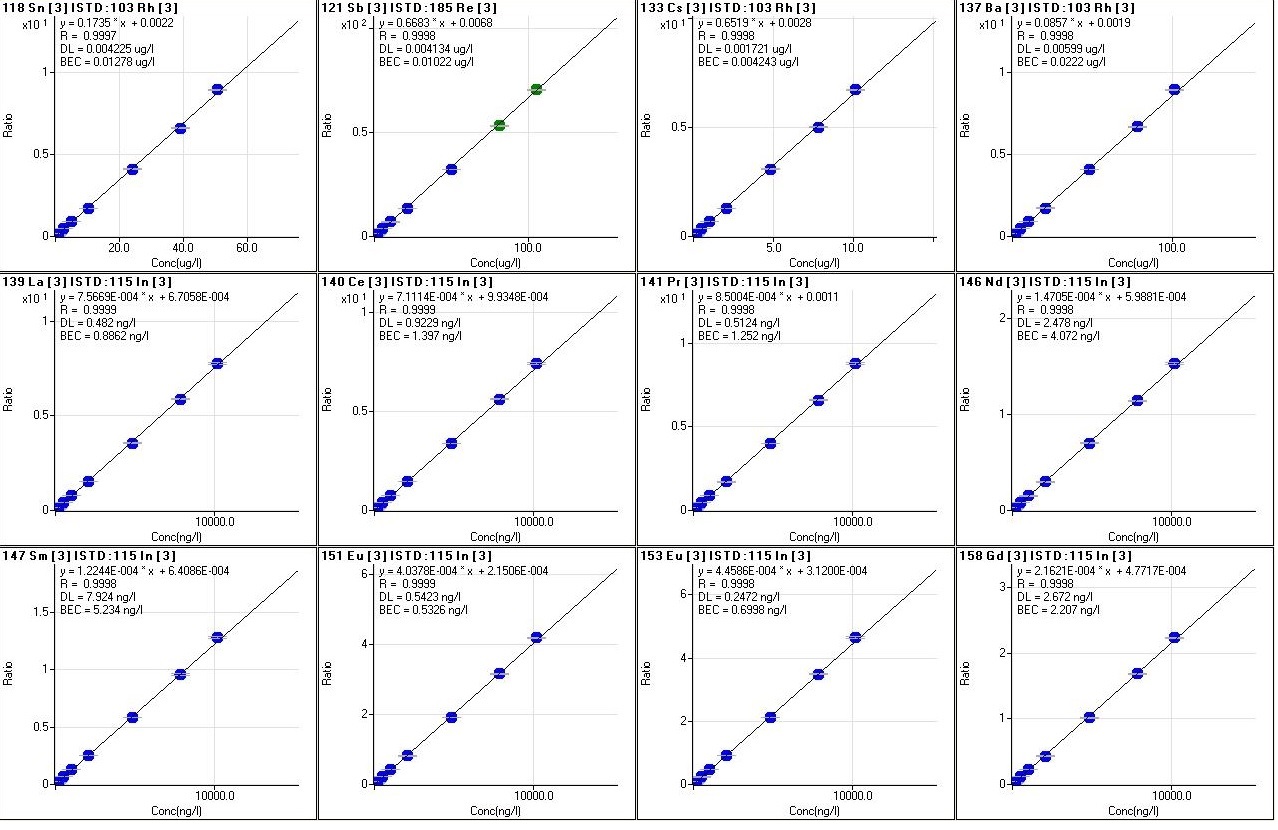
Fig.8: Calibration curves of various elements
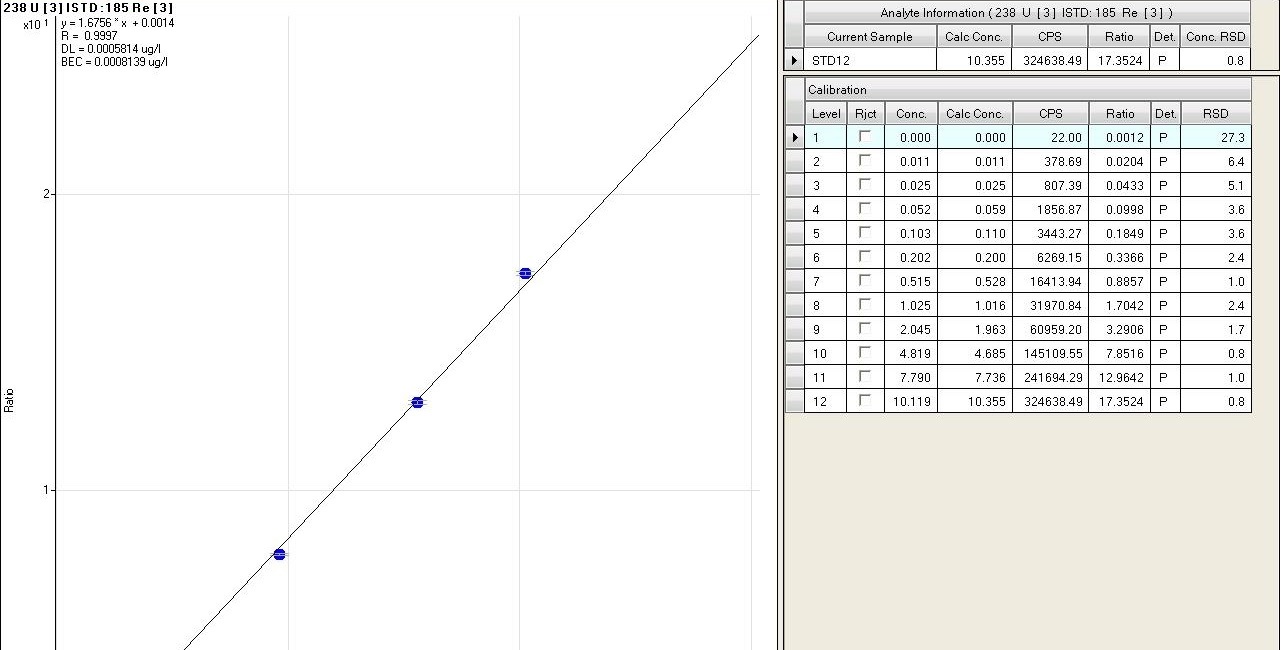
Fig.9: fig.9 Detail of a calibration curve


